Discover if your 2026 CX strategy is underperforming by reviewing these metrics before Q2 to enhance customer experience and retention.
Customer expectations are evolving faster than most dashboards can keep up with. If your 2026 customer experience (CX) strategy is falling short, the fastest way to course-correct before Q2 is to focus on metrics that reveal what customers feel, how easy it is to do business with you, and how efficiently your teams deliver. This guide highlights the CX measures that matter most, explains seven metrics leaders should evaluate now, and offers practical steps to convert insights into action before the next quarter begins. It also frames these as CX KPIs and customer experience KPIs you can operationalize with confidence.
Asked plainly: Is your 2026 CX strategy underperforming?. 7 metrics to review before Q2 can give you a decisive answer. Treat these CX performance indicators as non-negotiables, and align them with contact center KPIs, cost-to-serve metrics, and customer retention metrics that tie directly to growth. When your CX strategies are grounded in strong customer service performance metrics, momentum follows.
Understanding Customer Experience Metrics
Customer experience metrics quantify how customers perceive, interact with, and progress through your end-to-end journey. They capture satisfaction, effort, loyalty, and operational performance across channels such as voice, chat, email, self-service, and social. In practice, these are your core CX KPIs, the daily pulse of your operation.
These measures matter because they turn subjective experiences into objective signals you can manage. Without them, teams rely on anecdotes or lagging indicators like revenue and churn to diagnose issues that often originate in support interactions, digital journeys, or fulfillment processes. CX performance indicators make the invisible visible and actionable.
Metrics guide decisions by making trade-offs explicit and investments accountable. For example, a rising Customer Effort Score can predict churn more reliably than a middling satisfaction score, signaling a need to remove friction before adding features. Likewise, Cost-to-Serve clarifies where automation or channel shift can protect margins without degrading quality. Those cost-to-serve metrics, paired with customer retention metrics, ensure your CX strategy balances experience and economics with precision.
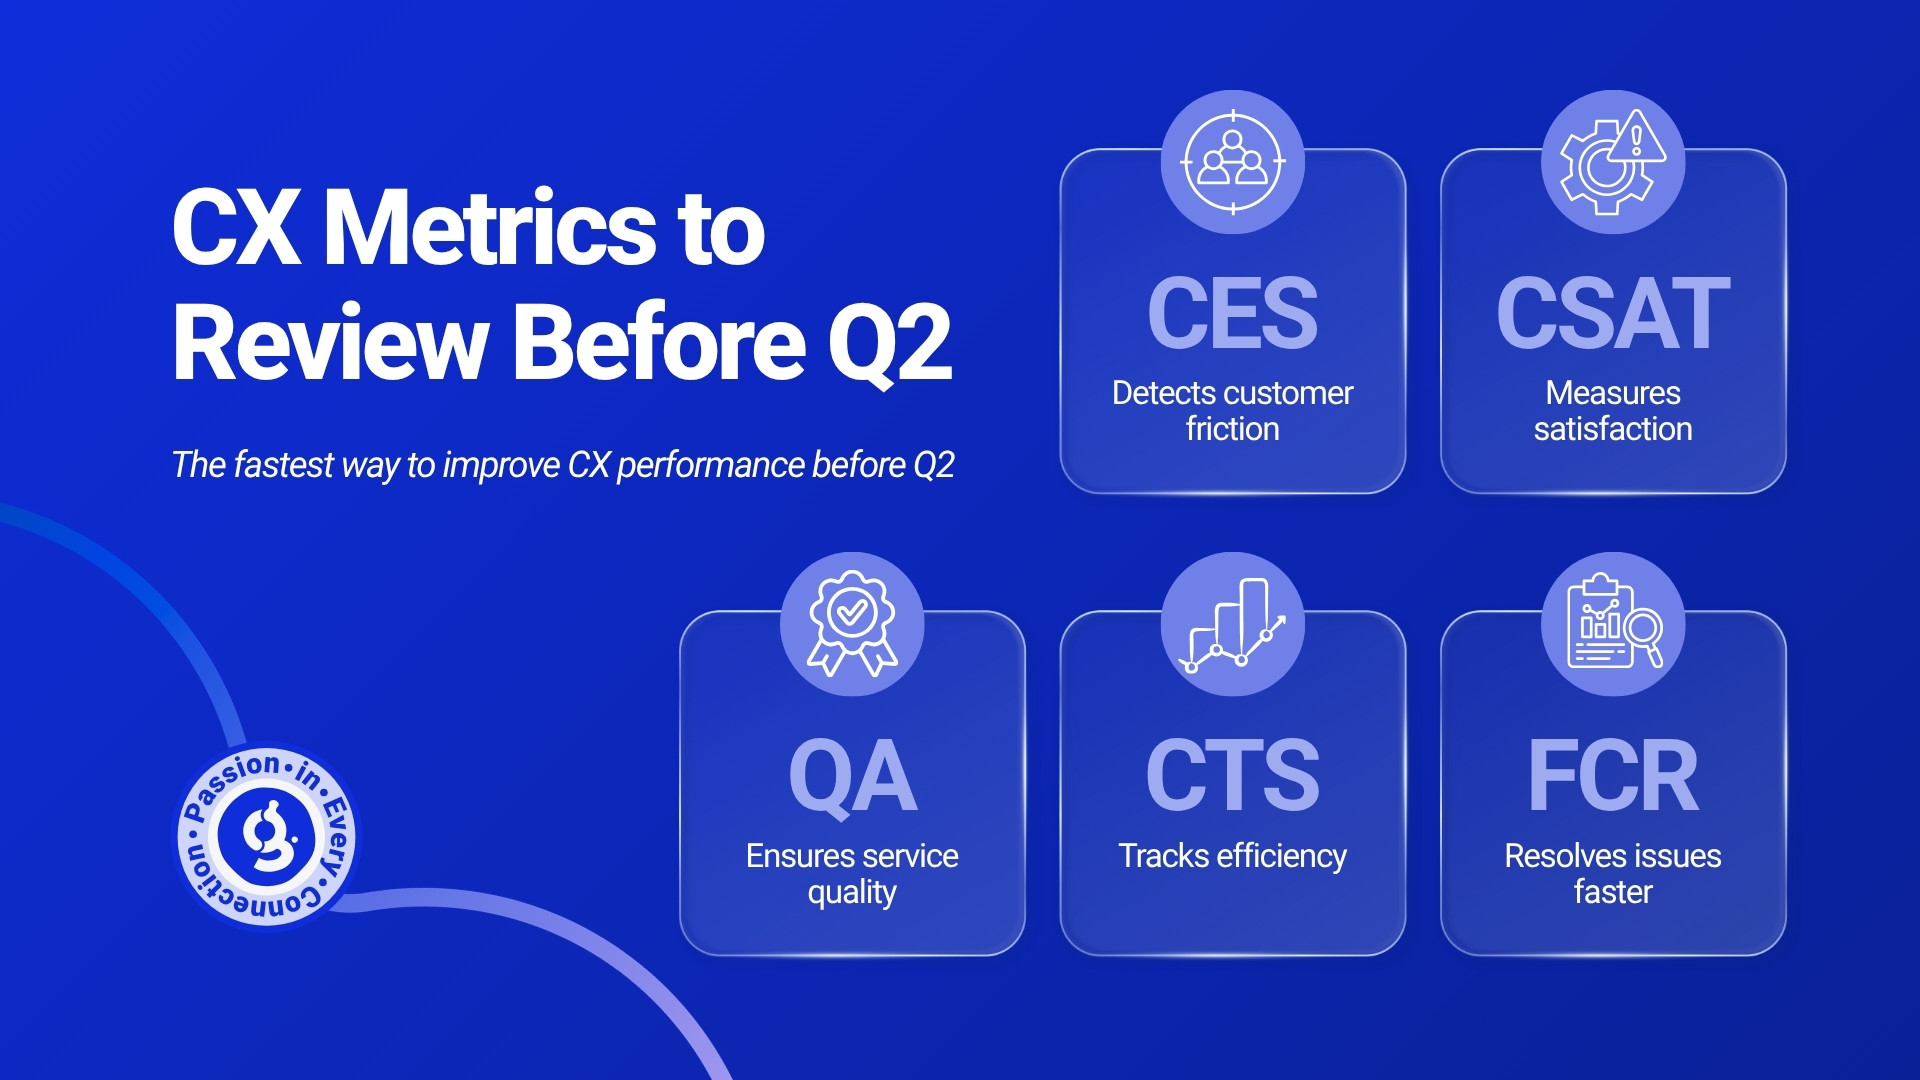
The Seven Key Metrics to Evaluate
Here is what to review now as you refine CX strategies and sharpen your CX KPIs:
1) Customer Satisfaction Score (CSAT)
CSAT captures immediate sentiment after an interaction, purchase, or milestone. Track overall CSAT and break it down by channel, issue typhttps://theofficegurus.com/is-your-2026-cx-strategy-underperforming-7-metrics-to-review-before-q2/e, and agent. Watch for gaps between digital and voice support, and between new and returning customers. A decline in a single channel often signals an upstream process issue, such as a checkout bug that pushes more calls. Use CSAT benchmarks relevant to your industry and complexity, and refresh them quarterly to reflect seasonality and product changes.
2) Net Promoter Score (NPS)
NPS measures the likelihood to recommend and serves as a proxy for loyalty. Segment by tenure, product line, and lifecycle stage. Look beyond the composite score to the mix of promoters, passives, and detractors. Themes from detractors often point to experiences worth fixing before they trigger churn or social complaints. Pair NPS movements with customer retention metrics to understand how shifts in advocacy translate to renewal and expansion.
3) Customer Effort Score (CES)
CES assesses how easy it is for customers to accomplish a task. It is among the strongest predictors of repeat business. Use CES after case resolution and at critical digital milestones (such as password reset or subscription changes). If effort is high for simple tasks, simplify forms, reduce steps, or clarify help content. As a customer experience KPI, CES provides an early-warning system that lets you act before dissatisfaction hardens into attrition.
4) Cost-to-Serve (CTS)
CTS measures the total cost per interaction or per resolution, including labor, technology, and overhead. Monitor by channel and issue type. Rising CTS with flat First Contact Resolution often indicates knowledge gaps, complex workflows, or underused self-service. Use CTS to validate where AI or process changes can reduce costs without harming the experience. Treat CTS and other cost-to-serve metrics as guardrails that keep optimization grounded in financial reality.
5) First Contact Resolution (FCR)
FCR reflects the percentage of issues resolved on the first interaction. It is a litmus test for knowledge management, training, and process design. Analyze by queue, shift, and agent. Tie FCR to repeat contact rates and CSAT to quantify the impact of rework on customers. Among contact center KPIs, FCR is the one that often unlocks simultaneous gains in satisfaction and efficiency.
6) QA Consistency Score
Quality assurance consistency measures how reliably agents follow processes, demonstrate empathy, and provide accurate information. Track not only average QA scores, but variation between evaluators and across teams. Inconsistent QA often masks uneven coaching or outdated scripts that erode trust. This customer service performance metric stabilizes outcomes and builds confidence in scaling.
7) Workforce Utilization & Shrinkage
Utilization is the percentage of paid time spent on productive work. Shrinkage covers time unavailable due to PTO, training, absenteeism, and other factors. High shrinkage or uneven utilization increases wait times and depresses CSAT. Granular visibility enables smarter scheduling, cross-training, and surge planning before peak periods. As CX performance indicators, these metrics help you protect service levels without overspending.
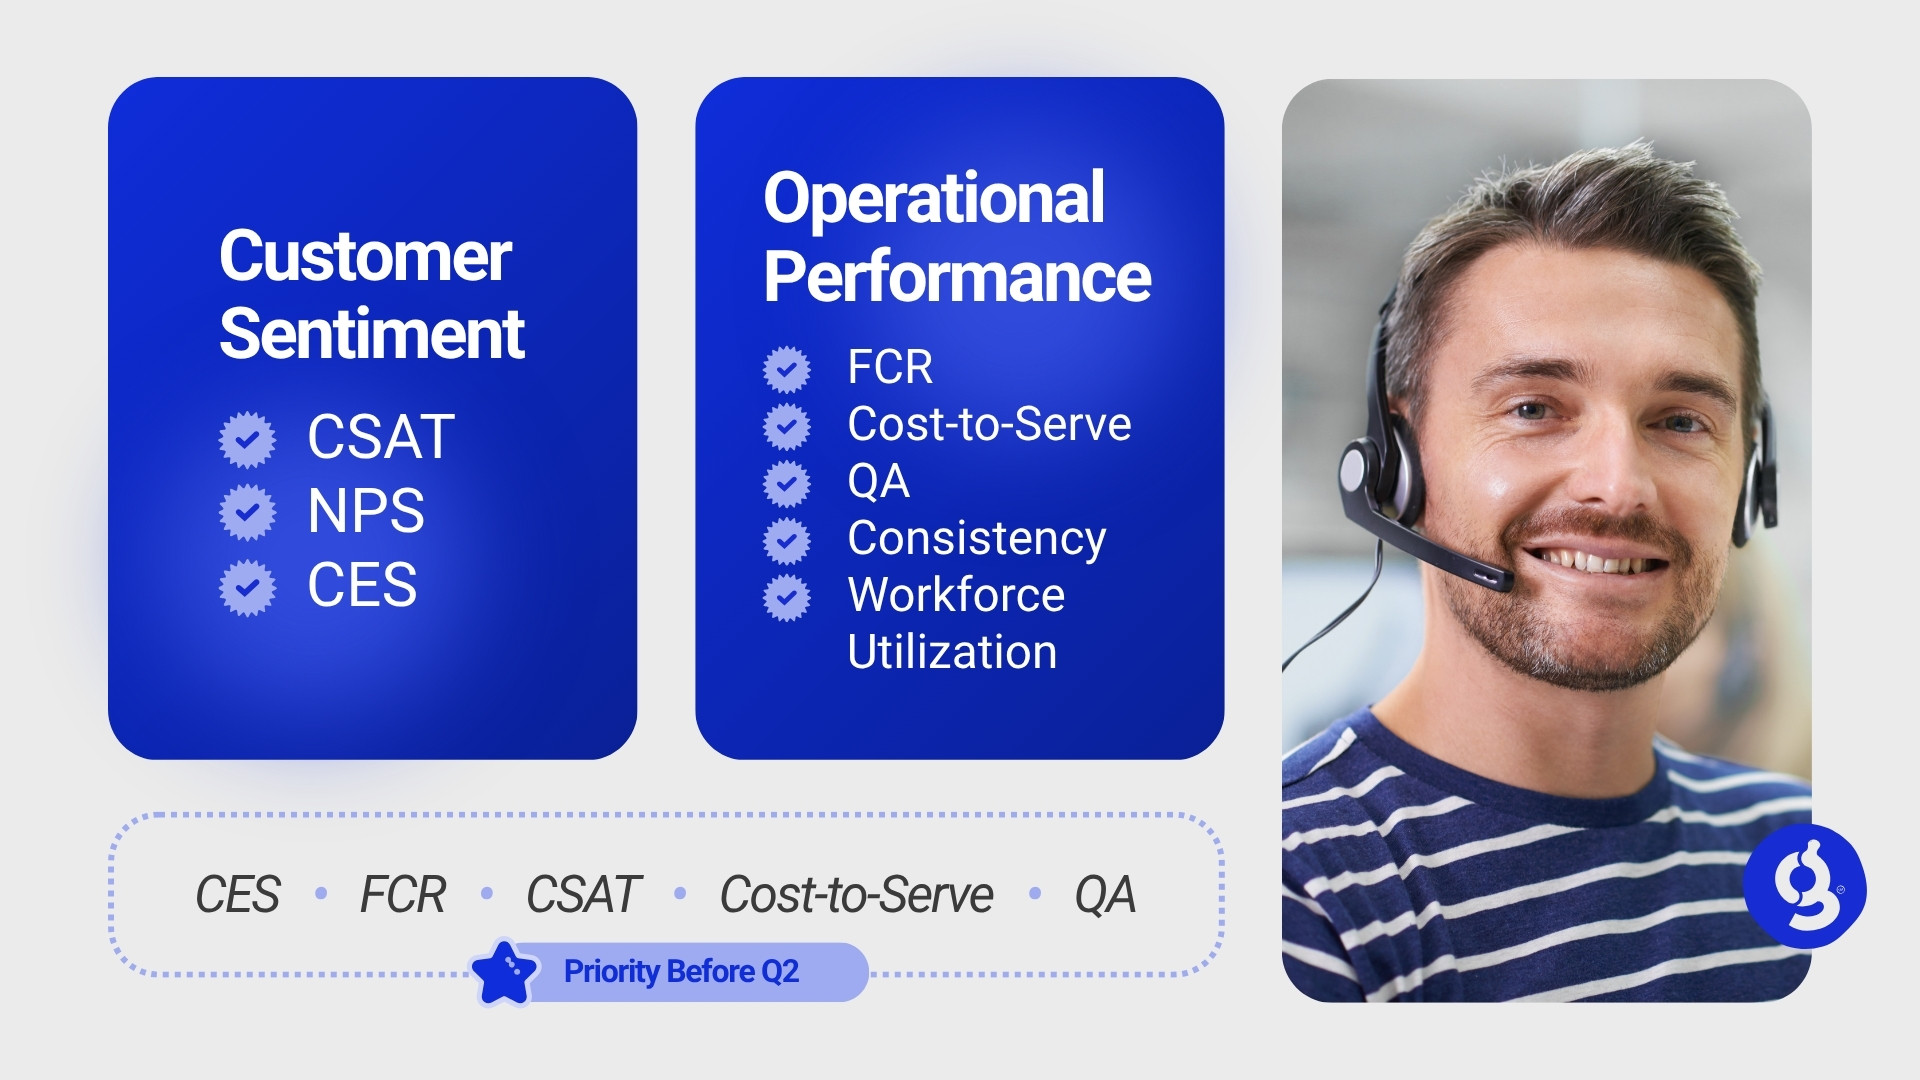
If you need to focus on these metrics to triage before Q2, prioritize CES, FCR, CSAT, CTS, and QA Consistency. Together, they expose friction, resolution effectiveness, sentiment, efficiency, and execution reliability, an essential set of customer service performance metrics to energize your CX strategy now.
Analyzing Customer Feedback Trends
Metrics point to where problems exist; feedback explains why. Combine structured survey data with unstructured text and transcripts to connect the numbers to real customer intent and emotion. Frontline perspectives are essential for validating patterns and rapidly testing fixes. The strongest CX strategies weave customer experience KPIs with qualitative insights to guide disciplined action.
Methods for collecting customer feedback
Use a blend of signals at multiple journey points: post-interaction CSAT, periodic relationship NPS, post-resolution CES, on-page micro-surveys for high-impact digital tasks, and community/social listening for unsolicited comments. Encourage open-text responses to capture context that numeric ratings miss. Close the loop with detractors and customers who abandoned high-effort tasks.
Tools for analyzing feedback data
Apply text and speech analytics to cluster themes (such as billing confusion or shipping delays) and detect sentiment. Tag feedback by product, channel, and issue type to enable targeted fixes. Dashboards that combine operational metrics (FCR, average handle time, transfer rate) with sentiment indicators help quickly isolate root causes. Use these CX KPIs alongside customer retention metrics to see which experiences most influence revenue outcomes.
Identifying patterns and areas for improvement
Look for recurring drivers across multiple data sources. If detractors in NPS cite “couldn’t get a straight answer,” and QA reviews reveal inconsistency on policy updates, prioritize training and knowledge base updates. If CES spikes for account changes and digital logs show repeated switching between app and email verification, streamline authentication. Fixes that lower effort and reduce repeat contacts typically deliver the fastest gains in satisfaction and cost, reinforcing your cost-to-serve metrics and improving contact center KPIs.
The Impact of Technology on CX Metrics
Technology can amplify your ability to measure, predict, and improve experiences when deployed with clear objectives. Select tools that remove effort, improve resolution, and deliver consistent, accurate information across channels. Anchor every deployment to specific CX performance indicators and customer service performance metrics so value is visible.
Role of AI and automation in data analysis
AI classifies feedback at scale, spots emerging issues, and scores sentiment across calls and chats. In live operations, AI supports agents with next-best responses, form prefill, and knowledge retrieval, improving FCR and reducing handle time without compromising quality. Automation works best when it removes steps for routine requests (such as refunds with clear rules or order status) and deflects only those interactions that can be fully resolved through self-service. Track results through contact center KPIs and cost-to-serve metrics to confirm impact.
Utilizing CRM systems for better insights
Modern CRM platforms connect interaction history, orders, and customer profiles. Embedding CSAT, FCR, and notes into the record enables the identification of high-effort journeys, the highlighting of at-risk accounts, and the coordination of follow-ups. Integrating QA results and coaching records with CRM ensures systemic issues discovered in QA translate into knowledge updates and workflow changes, not just individual coaching. This creates a closed loop between CX KPIs and customer retention metrics.
Emerging technologies shaping customer experience
Generative AI is enhancing self-service with conversational guidance that understands context and reduces effort. Real-time agent assist tools deliver policy summaries and compliance prompts, improving QA consistency. Journey analytics map cross-channel paths and quantify struggle points. Combined with digital experience monitoring, these tools reveal friction earlier, allowing preemptive fixes before volumes spike. Tie each deployment to clear CX performance indicators to sustain momentum.
Preparing for Q2: Actionable Steps
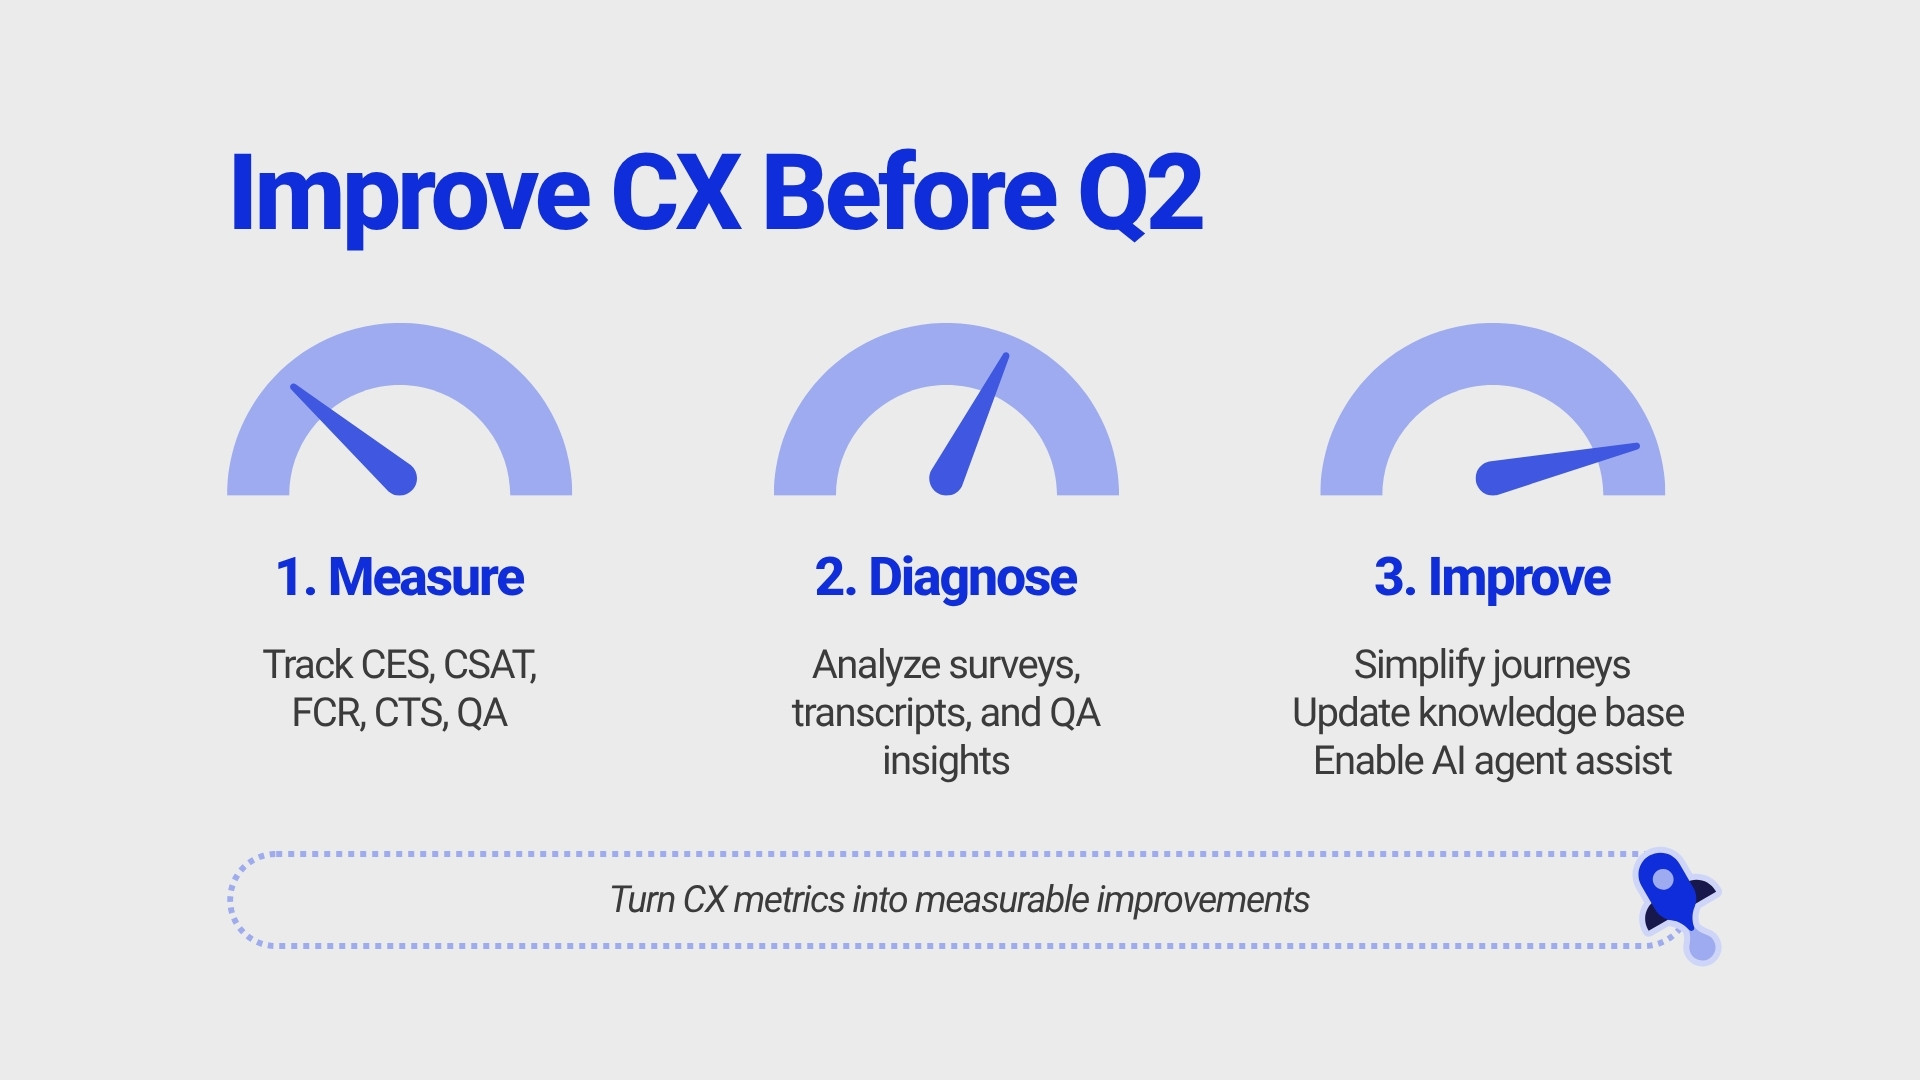
Use the next few weeks to set targets, align teams, and operationalize monitoring. Concentrate on initiatives that reduce effort, resolve issues in one touch, and standardize quality. This is where a bold CX strategy meets disciplined execution.
Setting realistic goals based on metrics
- Set a Q2 target for CES improvements across your top three high-volume journeys (for example, reduce average effort by 0.3 points). Establish CSAT benchmarks by channel and issue type, and measure weekly lift against them.
- Lift FCR by two to three percentage points by addressing the top five failure drivers identified in QA and root cause analysis.
- Reduce CTS per channel by directing repetitive contacts to verified self-service while maintaining or improving CSAT. Track CTS within your broader cost-to-serve metrics to verify sustainable savings.
- Reduce QA variance by defining critical behaviors and calibrating evaluators weekly. Treat QA consistency as a cornerstone customer service performance metric.
Aligning team efforts with CX objectives
- Translate metric targets into frontline behaviors: stronger verification prompts, clearer expectation-setting, and consistent resolution steps. Reinforce how these actions improve contact center KPIs and customer retention metrics.
- Update knowledge articles and macros to reflect the latest policies and known issues; retire outdated content that drives rework.
- Run micro-coaching on the most common failure points, using call snippets and chat transcripts to illustrate best practices.
- Bring product and engineering into weekly reviews of top effort drivers and detractor themes to accelerate fixes.
Continuous monitoring and adjustment strategies
- Host a weekly CX huddle to review FCR trends, repeat contact rates, and CES by journey. Make these sessions the heartbeat of your CX KPIs operating rhythm.
- Instrument digital journeys with event tracking to correlate drop-offs with support spikes.
- Implement a detractor callback program to validate fixes and uncover new friction.
- Refresh forecasts and schedules based on updated shrinkage assumptions, and protect coaching and QA time during surges.
Prioritizing the Metrics That Drive Fastest Q2 Impact
If you need fast traction, concentrate on these measures and pair them with clear owners and weekly readouts. Is your 2026 CX strategy underperforming? Here are some key metrics to review before Q2, with actions and cautions. Use them as your frontline CX performance indicators:
| Metric | Why It Matters Now | Quick Wins to Pursue | Watch-Outs |
| Customer Effort Score (CES) | Strong predictor of repeat usage and churn; surfaces journey friction early. | Simplify forms, reduce authentication steps, and improve the findability of help content. | Ensure sample sizes are adequate and capture both resolved and unresolved cases. |
| First Contact Resolution (FCR) | Directly tied to satisfaction, cost, and loyalty; reduces repeat contacts. | Deploy guided workflows, expand authorities within policy, and fix top transfer causes. | Define FCR consistently across channels; avoid one-and-done that skips needed follow-ups. |
| Customer Satisfaction (CSAT) | Captures immediate sentiment; sensitive to wait time, empathy, and clarity. | Update talk tracks, set expectations on timelines, and close cases with clear summaries. | Segment by channel and issue type to avoid masking problem areas. |
| Cost-to-Serve (CTS) | Aligns CX improvements with margin; reveals automation opportunities. | Shift simple, high-volume intents to self-service; deploy agent assist for complex work. | Track CSAT and CES alongside CTS to ensure savings do not hurt experience. |
| QA Consistency | Ensures standards are applied uniformly; stabilizes performance at scale. | Define non-negotiables, run weekly calibrations, and leverage real-time guidance. | Measure variance between evaluators and across teams, not just averages. |
Conclusion: Future-Proofing Your CX Strategy
Customer expectations will keep evolving in 2026, and the organizations that win are the ones that detect friction early and act fast. By focusing on effort, resolution, satisfaction, cost, and consistency, you create a CX engine that drives both better customer outcomes and stronger business performance. A resilient CX strategy isn’t reactive, it’s measured, intentional, and continuously optimized.
Future-proofing your CX means more than tracking metrics. It requires aligning teams around clear goals, acting on real-time insights, and investing in solutions that reduce effort while improving efficiency. When feedback informs product, policy, and operations, CX becomes a true growth driver and not just a support function.
If you’re looking to improve performance before Q2, now is the time to act. The right metrics will show you where to focus, but execution is what delivers results.
Need help turning your CX metrics into measurable growth?
The Office Gurus partners with organizations to optimize CX strategy, improve operational performance, and deliver scalable, high-quality customer experiences.
Contact us today to see how we can help you strengthen your CX strategy before Q2.
Frequently Asked Questions
How often should we measure CSAT, NPS, and CES?
Capture CSAT and CES immediately after interactions or key journey steps for timely feedback. Run relationship NPS quarterly or semiannually, supplemented with transactional NPS after significant milestones. Prevent survey fatigue by sampling and rotating channels, and review results against current CSAT benchmarks.
What is a good benchmark for FCR?
Benchmarks vary by industry and complexity, but many aim for 70% to 80% FCR across mixed channels. More important than the absolute number is a clear definition of first contact per issue across channels and the consistent tracking of repeat-contact drivers.
How do we reduce Cost-to-Serve without harming CX?
Identify high-volume, low-complexity requests and move them to intuitive self-service, achieving outcomes equal to or better than those from assisted channels. Use AI to assist agents with complex cases, reducing handle time and rework. Monitor CSAT and CES alongside CTS to validate savings, and roll these into your ongoing cost-to-serve metrics.
Should we prioritize NPS or CES?
If you need a fast impact before Q2, prioritize CES on your top journeys. Lowering effort typically boosts CSAT and lifts NPS over time. Maintain NPS as a strategic barometer while you remove the friction customers feel today, and track the downstream effect through customer retention metrics.
What is QA Consistency, and how do we improve it?
QA Consistency reflects how uniformly standards are applied and followed. Improve it by defining non-negotiable behaviors, calibrating evaluators weekly, using objective evidence like call snippets and transcripts, and deploying real-time guidance that prompts policy and compliance steps.
Which technologies deliver the fastest CX gains?
Agent assist for knowledge retrieval, improved search and tagging for knowledge bases, automated workflows for routine tasks, and conversational self-service on narrow, well-defined intents usually deliver quick wins. Prioritize tools that shorten steps and increase FCR over those that only add reporting, and measure success through contact center KPIs and cost-to-serve metrics.
How do we tie CX metrics to revenue?
Link survey and operational data to customer records, then track changes in purchase frequency, expansion, and churn. Use cohort analysis to quantify the impact of improved CES or FCR on retention and lifetime value. Present results with clear before-and-after timelines tied to specific fixes, and verify the financial narrative with customer retention metrics and CSAT benchmarks.